
Display OpenCover results in Azure DevOps
So with my first post I managed to run OpenCover in the build and measure the code coverage on my .Net API by end-2-end tests. Of course this is fun, but it would be much more of value if we could also show the results somewhere. So in this post I will explain how to update the build to make this happen. In the end the results will be displayed in an Azure DevOps dashboard or SonarQube/SonarCloud.
 Photo by Joshua Earle on Unsplash
Coverage
To get the coverage attached to the build we can use the Publish Code Coverage Result Task. Because this task needs Cobertura or JaCoCo as input we need to make sure we get this output from OpenCover. Out-of-the-box OpenCover is not able to create such a file. Also the OpenCover result file contains paths to probably folders which don’t exist anymore. So in order to fix that we need to replace the paths to the existing application source on the build agent:
$content = (Get-Content $(Build.SourcesDirectory)\opencover-reports\result.xml) -replace '(\w\:)\\(\w+)\\(\d+)\\(\w+)', '$(Build.SourcesDirectory)';
[System.IO.File]::WriteAllLines( '$(Build.SourcesDirectory)\opencover-reports\result.xml', $content)
After this is done, with ReportGenerator OpenCover output can be transformed into one of the required formats. (and a lot of other formats) So with this command we can make sure we get the right format:
ReportGenerator.exe "-reports:$(Build.SourcesDirectory)\opencover-reports\result.xml" "-targetdir:coveragereport" -reporttypes:HTML;Cobertura;SonarQubeYou could either set the targetdir to a file share or copy the report folder back to the build agent in the end. ReportGenerator also has to capability to merge multiple coverage files into one file. So if you want to merge multiple test output files into one test result you can use this:
ReportGenerator.exe "-reports:OpenCover.xml;OpenCover2.xml" "-targetdir:coveragereport" -reporttypes:HTML;Cobertura;SonarQube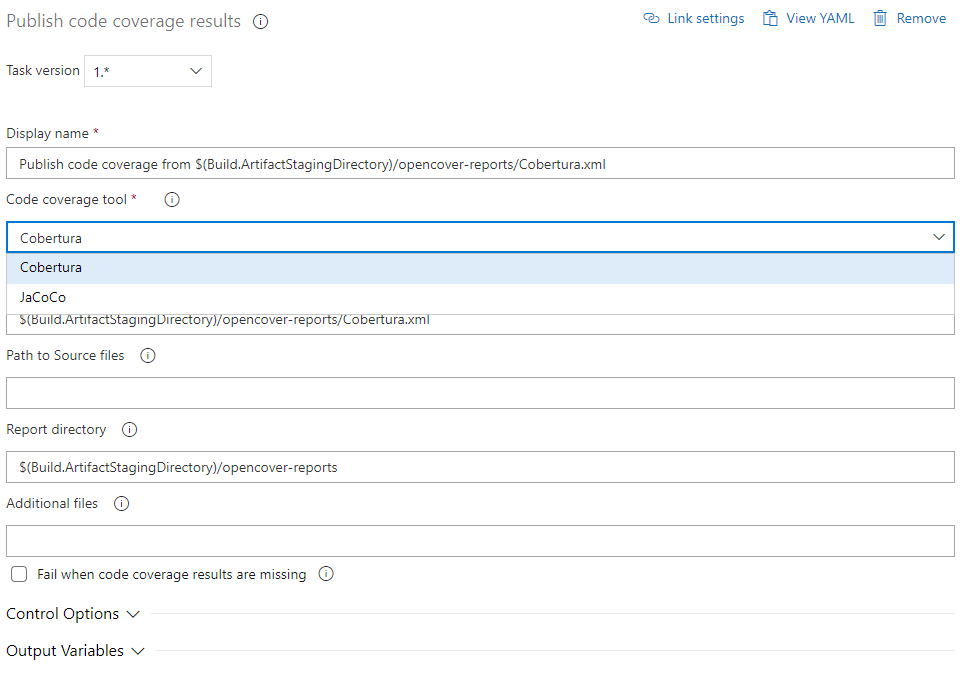
Publish coverage
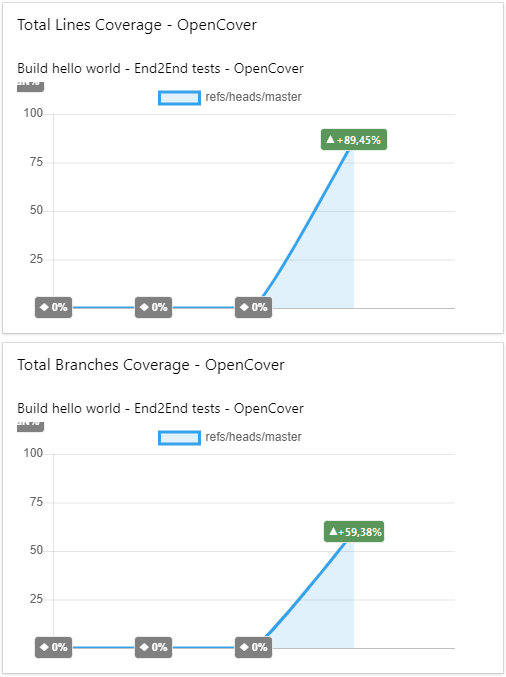
Now we’ve got our Cobertura file (and SonarQube file) we can use the publish code coverage task. Set the Cobertura file as ‘Summary file’ and we are good to go. After running the build you should be able to see the code coverage in the build results. As a final step we can add the “Code Coverage Widgets” to a dashboard in Azure Devops. When configuring this widget select our build and choose one of the coverage measurements. Small blocks will show as number/percentage and larger blocks will show graphs.
SonarQube/SonarCloud
Beside Azure DevOps we can also supply the coverage to SonarQube. Therefore we need to set the ‘sonar.cs.opencover.reportsPaths’ property to the path of the SonarQube.xml created by ReportGenerator. Now the Sonarscanner should be able to upload the file to SonarQube.
For SonarCloud or a newer version of SonarQube you need to set the ‘sonar.coverageReportPaths’ property.
Result
Now code coverage will automatically be updated and published to the desired tool/dashboard. New tests or missing tests will immediately affect the results. By doing this, we avoid the need to publish this by hand and we are always able to get the latest state of coverage for different kinds of tests.
An example of how the pipeline could look like can be found here
If you have any questions, feel free to contact me.