
Troubleshoot Azure App Service instances for Linux
We experienced CPU and memory issues with our Blazor application a few weeks back. To find out what was going on, we needed to create a memory dump to see what threads were causing issues.
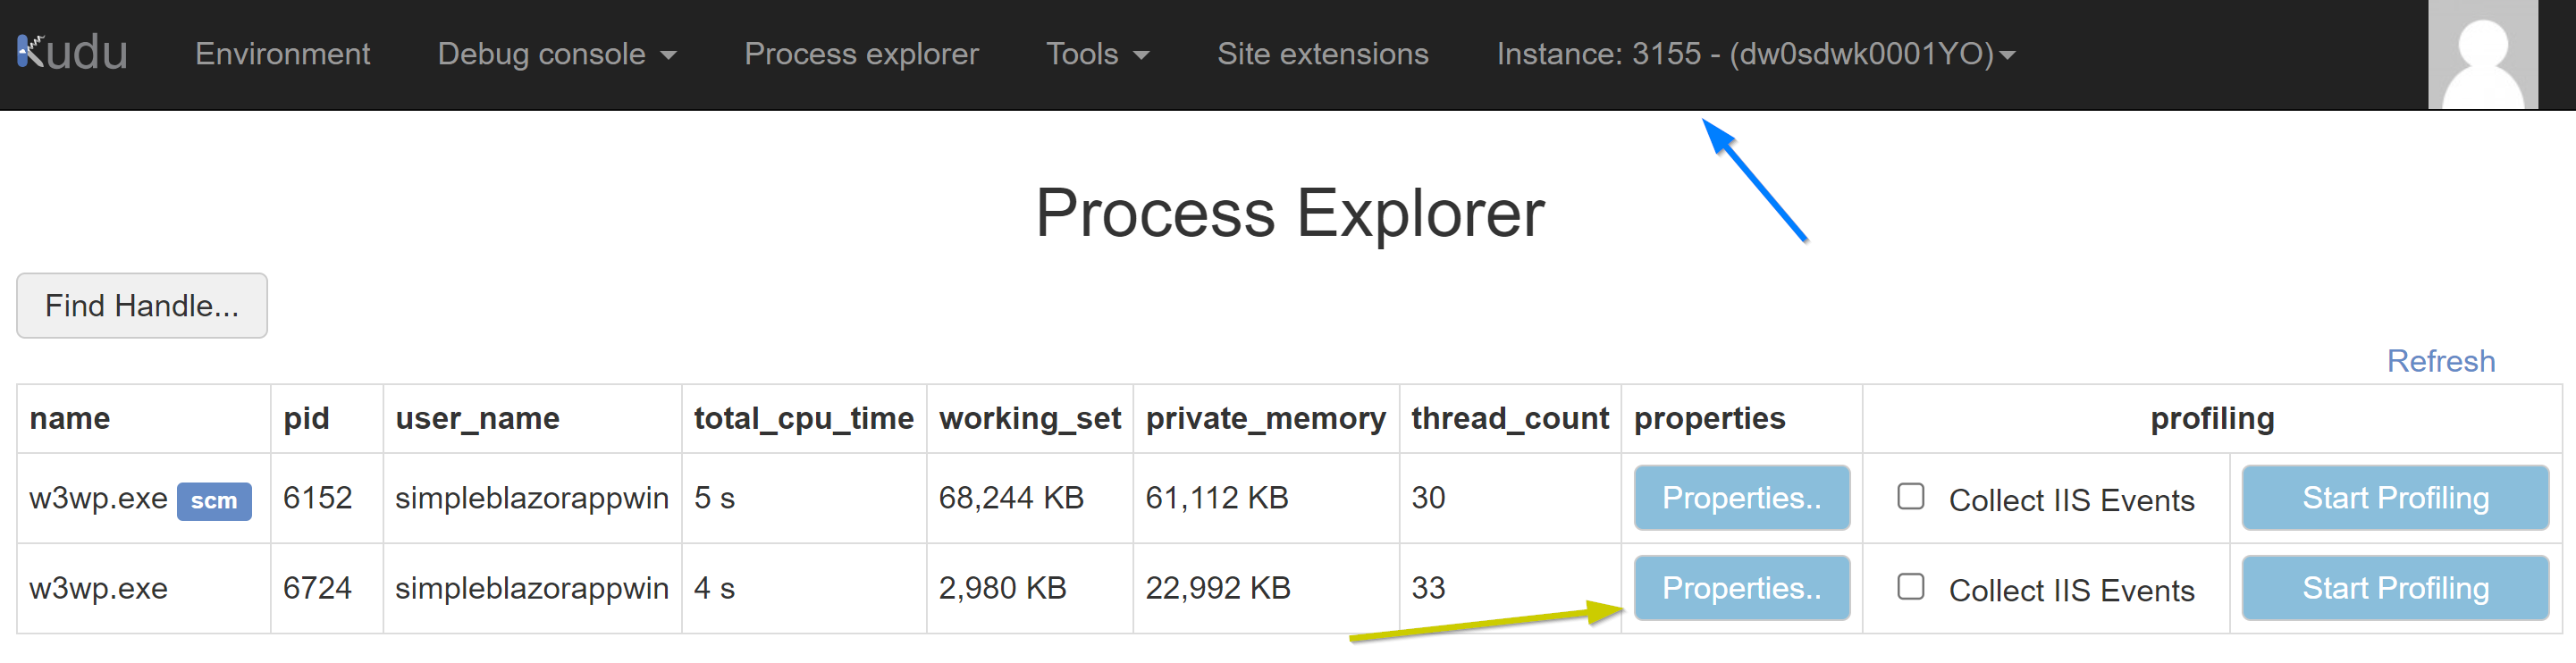
When running an application in Azure App Services with a single instance, it’s easy to debug or troubleshoot that instance. With Kudu, you can find all sorts of debug information. If that instance has a memory leak or serious CPU issues, then you can open Kudu and go to the Process Explorer page. From there, you can collect and download a memory dump from the application.
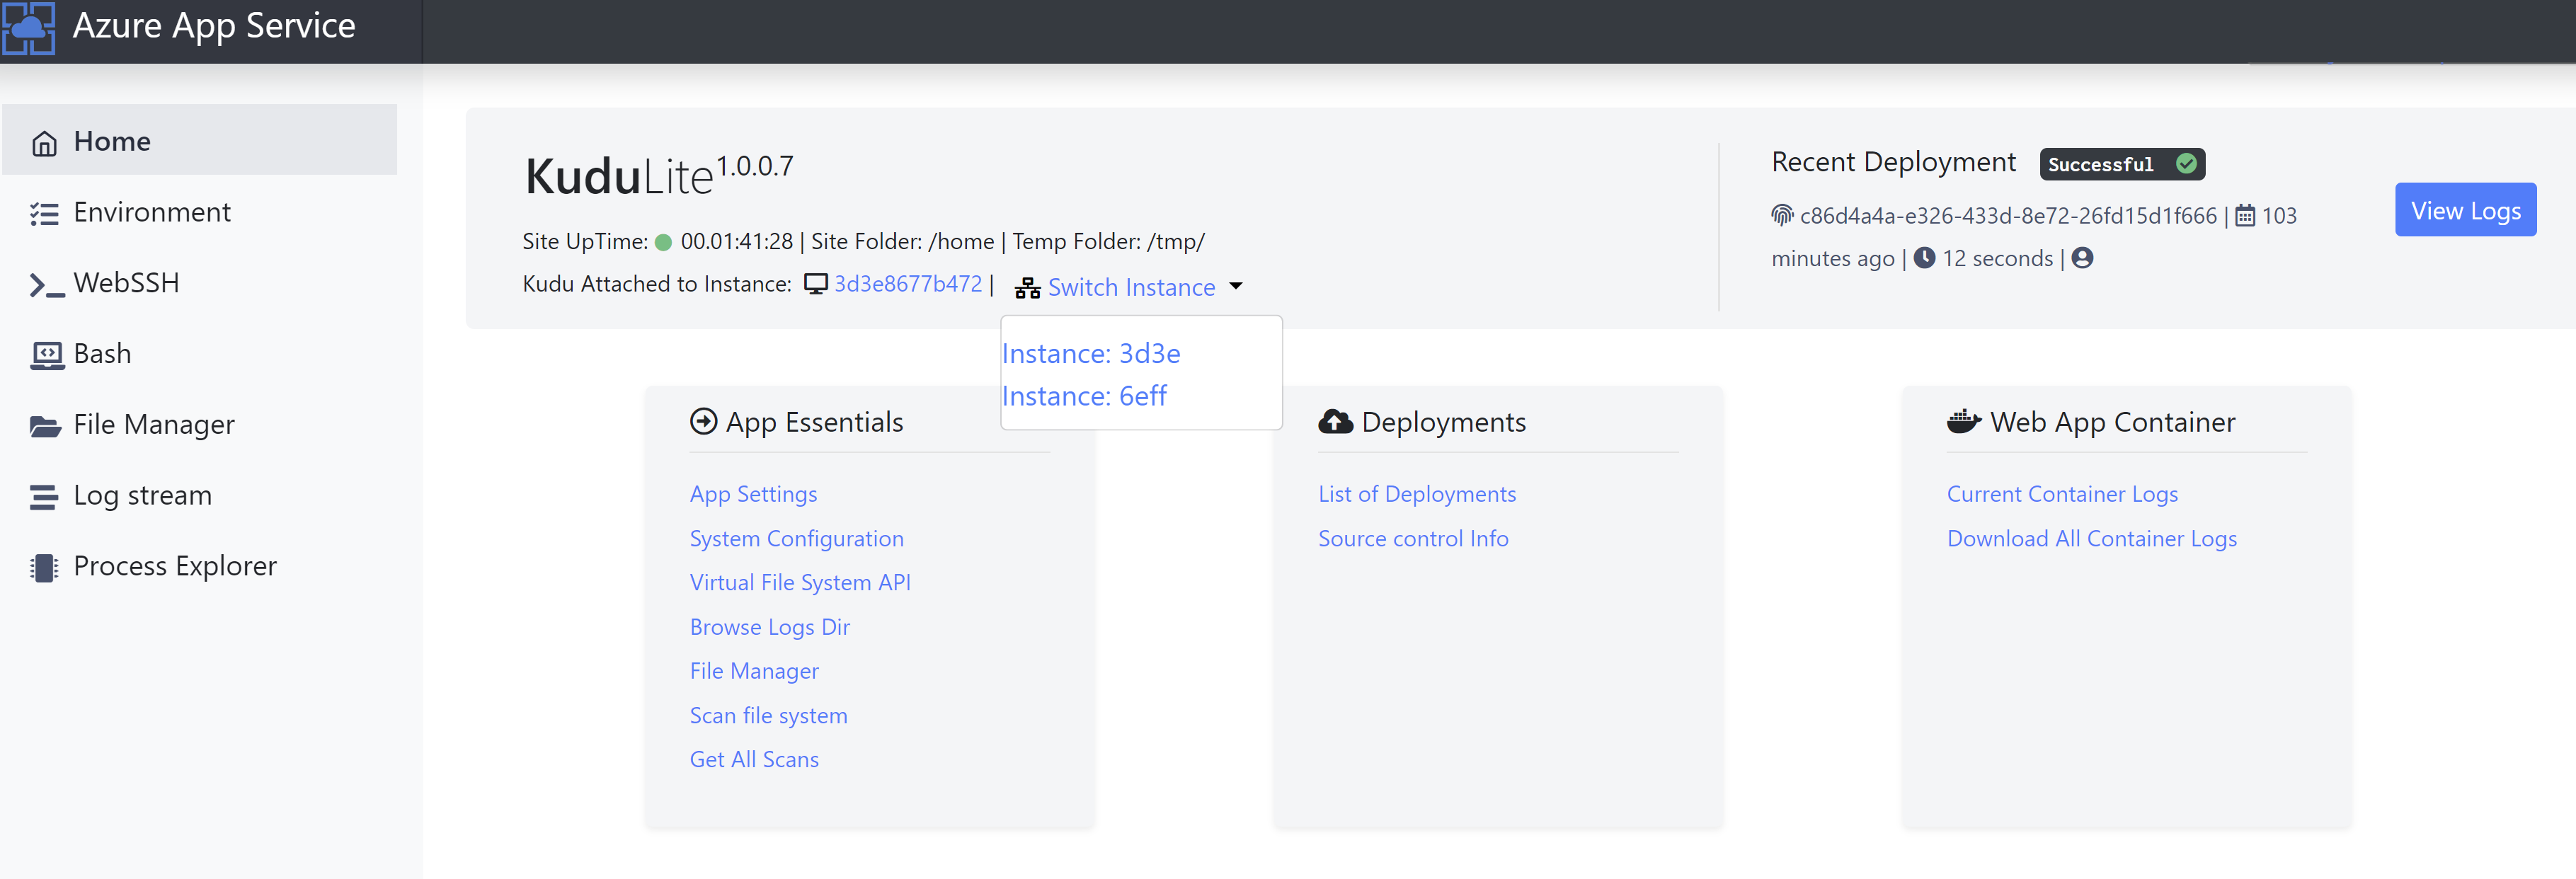
When running multiple instances of your application, this isn’t much harder. As shown in the image above, you can easily switch between instances. This also includes the familiar name, which can be found in Application Insights. So it’s easy to navigate from the log or graph, which shows a memory or CPU issue, to the specific instance in Kudu and troubleshoot it.
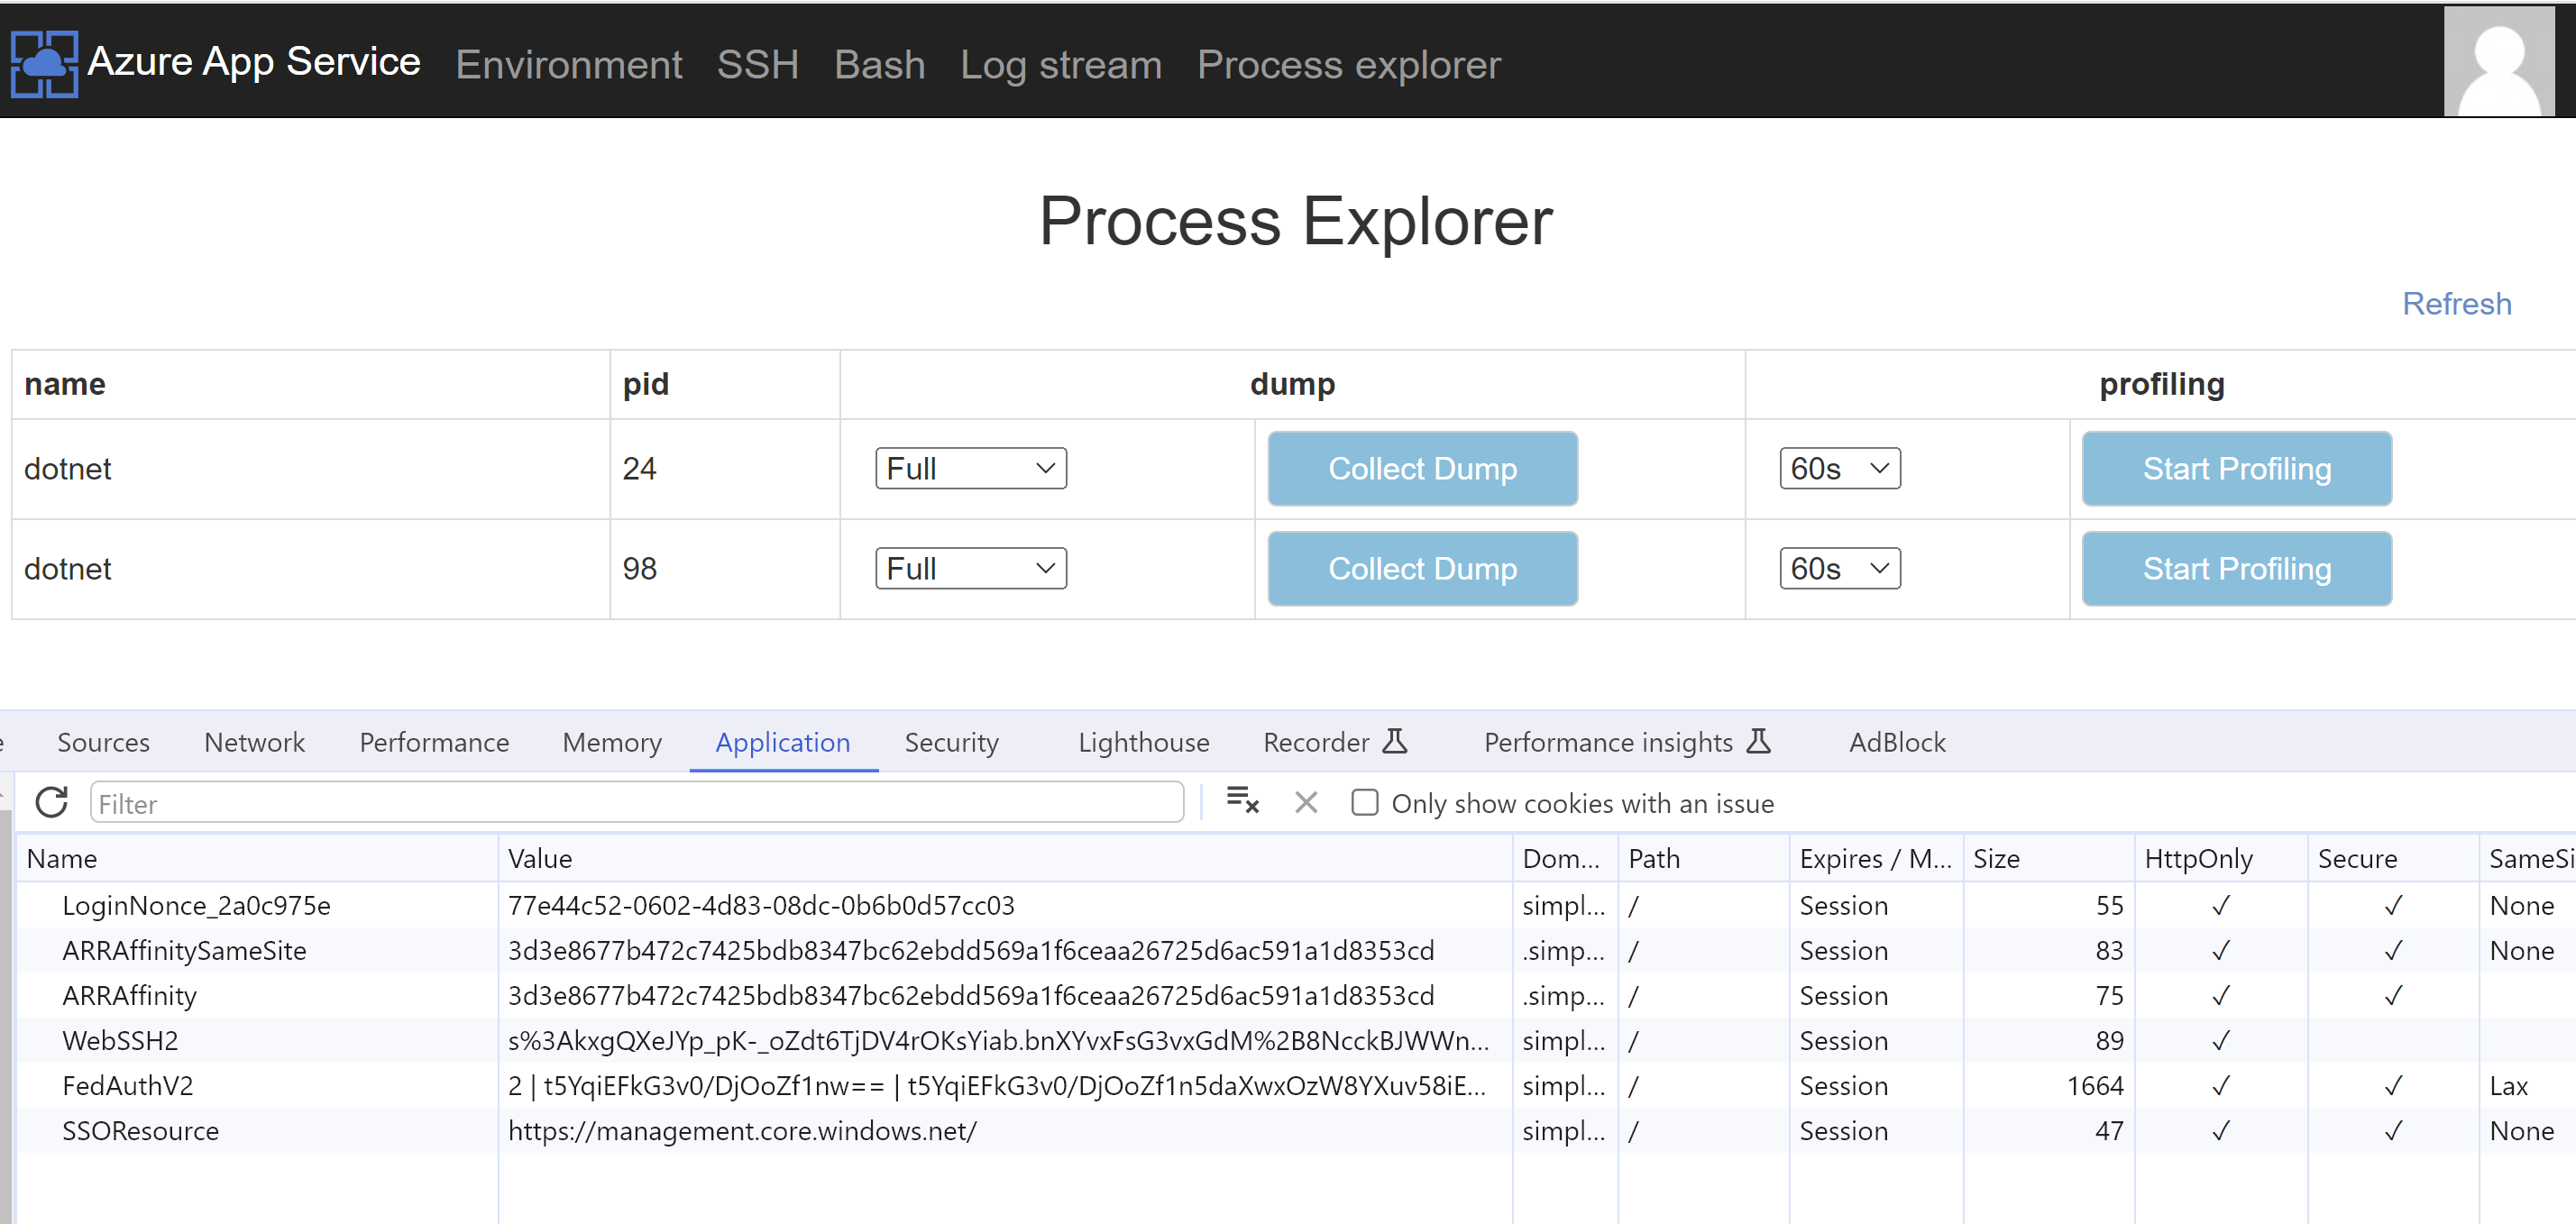
However, in our case, the application runs on Linux. For Linux, Kudu has limited UI features to achieve the same thing. There is no UI control to switch between instances, as shown in the image below.
The hard way is to change the ID in the ARRAffinity cookie to the instance you want to troubleshoot. But to figure out which id is which instance is a challenge.
There is a way to get a better experience.
If you navigate to https://
If you navigate to the Environment page, look up the variable called “COMPUTERNAME”; this shows the instance you can correlate to the logs or graphs you use. After selecting the correct instance, go to the Process Explorer page and press the Collect Dump button. Make sure to select the proper process; one process is for Kudu, and the other is for your application. By clicking the i icon, you can find out which one is which.
After downloading the memory dump, you can open Visual Studio and select Open File. Then, select the downloaded dump, and you will be ready to read it. If you select one of the “Debug with …” options, you can find the threads that were active at the time the memory dump was generated.
New UI
I could not find any documentation about this /newui and there is also no direct reference from the App Service in Azure. Too bad the new ui isn’t the standard, as it is more helpful for Linux apps. There is this older blog, but no follow-up. Also the version used in that post is still the version of Kudu as used today.